
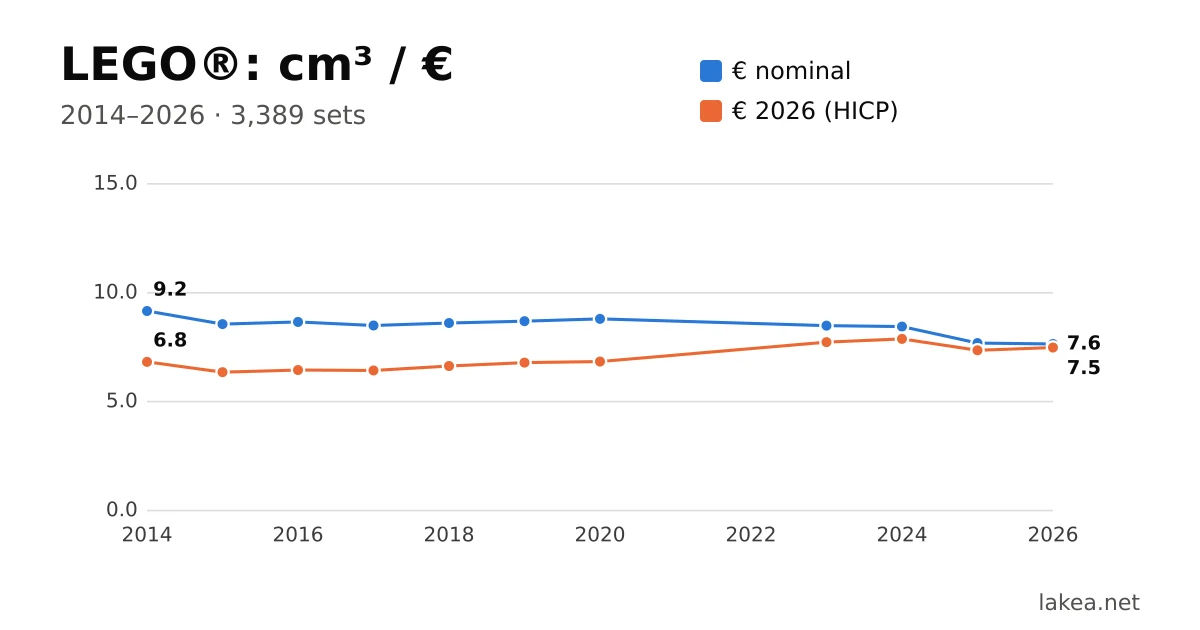
At a fixed price point, most LEGO® themes contain less plastic than in 2014. A €19.99 set is smaller now than a €19.99 set was then.
At the same time, prices in general have risen faster. Measured in purchasing power, 8 of the 18 themes actually give you more plastic for your money than in 2014. Only Speed Champions gives you less in purchasing power as well.
Both results are true at once. Both are shown below, for 3,389 sets in 72 themes.
At a fixed euro amount (nominal)
- Less plastic, demonstrated (11): Classic (−5.3%), Speed Champions (−4.8%), Icons (incl. Creator Expert) (−4.0%), 4+ and Juniors (−3.0%), Marvel Super Heroes (−2.5%), Technic (−2.4%), Ninjago (−2.2%), Creator (−2.2%), Friends (−1.8%), Minecraft (−1.6%), City (−0.9%) per year.
- Probably less (1): Star Wars (−1.0%) per year.
- Not demonstrated (6): Harry Potter, Seasonal, BrickHeadz, DC Super Heroes, Ideas, Disney.
- All themes together: −1.1% per year (margin −1.4% to −0.9%).
Adjusted for inflation (purchasing power)
- Less plastic (1): Speed Champions (−2.0%) per year.
- More plastic (8): Friends (+1.1%), Minecraft (+1.4%), Star Wars (+2.0%), BrickHeadz (+2.2%), DC Super Heroes (+2.3%), City (+2.0%), Ideas (+2.6%), Disney (+3.5%) per year.
- No difference demonstrated (9): Classic, Icons (incl. Creator Expert), 4+ and Juniors, Marvel Super Heroes, Technic, Ninjago, Creator, Harry Potter, Seasonal.
- All themes together: +1.7% per year (margin +1.4% to +2.0%).
Parts are getting smaller. An average part is now 23% smaller than in 2014. That is why the price per piece says less and less about how much LEGO® you get.
The percentages per year apply at an equal price level: a €20 set is compared with a €20 set. All quantities are calculated from 3D models of the parts, not weighed.
Two ways of looking at the same numbers
LEGO® works with fixed price points: €9.99, €19.99, €49.99. When costs rise, a manufacturer can raise the price or put less in the box. The latter is called shrinkflation. The nominal measurement shows whether that happens: do you get less for €19.99 now than you used to?
But €19.99 in 2014 was worth more than €19.99 now. According to Eurostat, consumer prices in the euro area rose by 36% from January 2014 to September 2026. So we also convert the prices to September 2026 euros. That is the measurement in purchasing power.
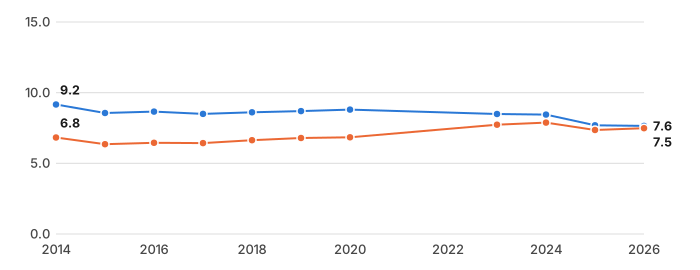
nominal (euros of that year) purchasing power (September 2026 euros)
All measured sets except the 4+ line. The axis starts at zero. 2021 and 2022 are missing: because of the price rule (see How we calculate) only 81 and 73 sets count there, mostly sets that were on sale briefly. These medians do not account for price level; the percentages in this article do.
The blue line falls slightly, the orange line rises. LEGO® sets got less plastic per euro, but more slowly than the euro lost value.
Why not simply the price per piece?
The price per piece is the best-known measure for comparing LEGO® sets. Lakea uses it too. But a piece is not a fixed unit. A 1x1 plate and a large baseplate both count as one part.
When parts get smaller, the price per piece stays the same while you get less LEGO®. That is happening too.
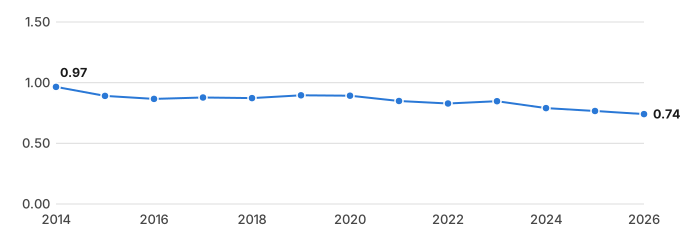
All measured sets with a price, except the 4+ line. Only years with at least 30 sets. The axis starts at zero.
Results per theme
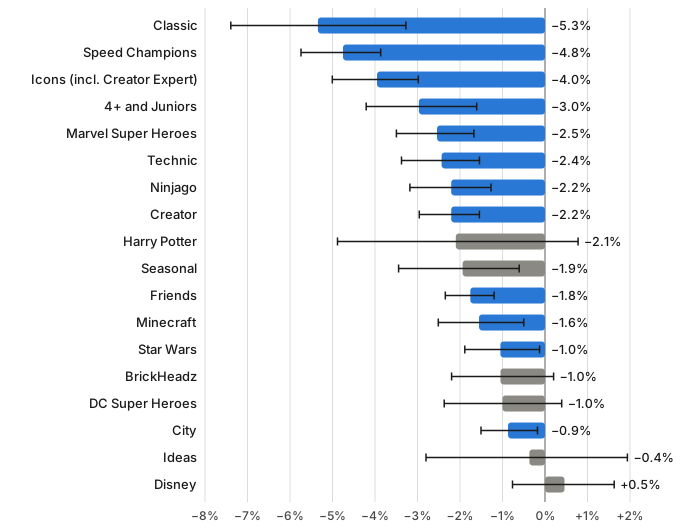
demonstrated or probable not demonstrated line = margin of uncertainty (95%)
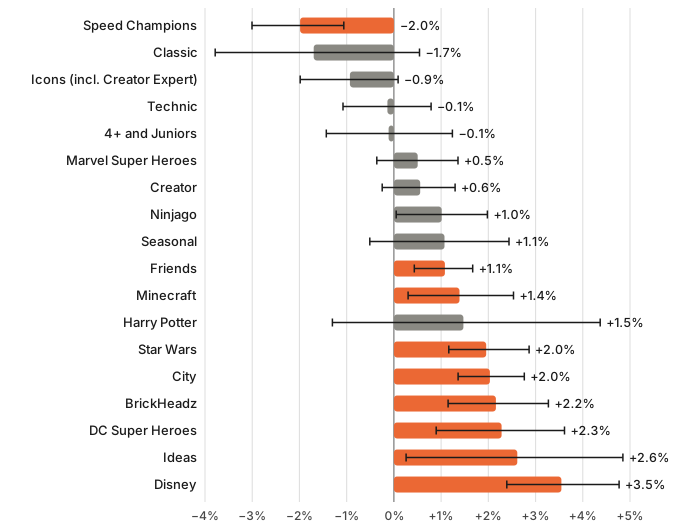
difference demonstrated no difference demonstrated line = margin of uncertainty (95%)
Nominally, a theme counts as demonstrated when the direction is the same in every calculation variant and the decline falls outside the margin of uncertainty in all variants but one at most. Probable: the same direction everywhere, outside the margin in all variants but two at most. In purchasing power, a difference counts as demonstrated when the whole margin of uncertainty lies on one side of zero, both with and without the price rule.
| Theme | Sets | Years | Nominal per year | Margin (95%) | Verdict | Purchasing power per year | Margin (95%) | Verdict |
|---|---|---|---|---|---|---|---|---|
| Classic | 45 | 2015–2025 | −5.3% | −7.4% / −3.3% | demonstrated | −1.7% | −3.8% / +0.5% | no difference |
| Speed Champions | 82 | 2015–2026 | −4.8% | −5.7% / −3.9% | demonstrated | −2.0% | −3.0% / −1.1% | less |
| Icons (incl. Creator Expert) | 113 | 2014–2026 | −4.0% | −5.0% / −3.0% | demonstrated | −0.9% | −2.0% / +0.1% | no difference |
| 4+ and Juniors | 135 | 2014–2026 | −3.0% | −4.2% / −1.6% | demonstrated | −0.1% | −1.4% / +1.2% | no difference |
| Marvel Super Heroes | 180 | 2014–2026 | −2.5% | −3.5% / −1.7% | demonstrated | +0.5% | −0.4% / +1.4% | no difference |
| Technic | 153 | 2014–2026 | −2.4% | −3.4% / −1.5% | demonstrated | −0.1% | −1.1% / +0.8% | no difference |
| Ninjago | 177 | 2015–2026 | −2.2% | −3.2% / −1.3% | demonstrated | +1.0% | 0.0% / +2.0% | no difference |
| Creator | 164 | 2014–2026 | −2.2% | −3.0% / −1.5% | demonstrated | +0.6% | −0.2% / +1.3% | no difference |
| Harry Potter | 83 | 2018–2026 | −2.1% | −4.9% / +0.8% | not demonstrated | +1.5% | −1.3% / +4.4% | no difference |
| Seasonal | 113 | 2015–2026 | −1.9% | −3.4% / −0.6% | not demonstrated | +1.1% | −0.5% / +2.4% | no difference |
| Friends | 285 | 2014–2026 | −1.8% | −2.3% / −1.2% | demonstrated | +1.1% | +0.4% / +1.7% | more |
| Minecraft | 103 | 2014–2026 | −1.6% | −2.5% / −0.5% | demonstrated | +1.4% | +0.3% / +2.5% | more |
| Star Wars | 324 | 2014–2026 | −1.0% | −1.9% / −0.1% | probable | +2.0% | +1.2% / +2.9% | more |
| BrickHeadz | 150 | 2017–2026 | −1.0% | −2.2% / +0.2% | not demonstrated | +2.2% | +1.1% / +3.3% | more |
| DC Super Heroes | 69 | 2014–2026 | −1.0% | −2.4% / +0.4% | not demonstrated | +2.3% | +0.9% / +3.6% | more |
| City | 278 | 2013–2026 | −0.9% | −1.5% / −0.2% | demonstrated | +2.0% | +1.4% / +2.8% | more |
| Ideas | 69 | 2014–2026 | −0.4% | −2.8% / +1.9% | not demonstrated | +2.6% | +0.3% / +4.8% | more |
| Disney | 129 | 2014–2026 | +0.5% | −0.8% / +1.6% | not demonstrated | +3.5% | +2.4% / +4.8% | more |
What stands out
- Speed Champions is the only theme where you get less plastic in purchasing power as well (−2.0% per year). Nominally it is −4.8%.
- Classic (−5.3% nominal) consists mostly of boxes of loose bricks, without a licence and without a large model. That makes it the cleanest comparison. In purchasing power the difference is not demonstrated (−1.7%).
- Icons (−4.0%) and Technic (−2.4%) fall clearly in nominal terms, but stay roughly level in purchasing power.
- City falls the least of the demonstrated themes in nominal terms (−0.9%). In purchasing power City rises (+2.0%).
- Disney shows no nominal decline (+0.5%) and rises the most in purchasing power (+3.5%).
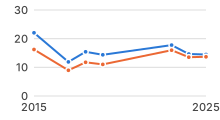
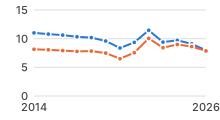
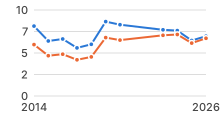
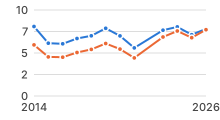
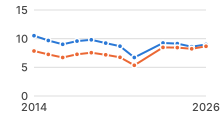
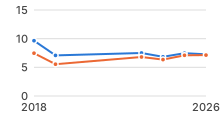
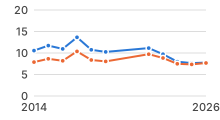
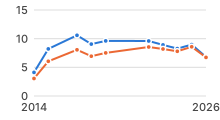
Per theme over the years
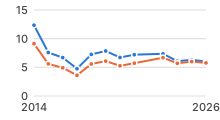
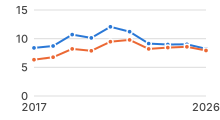
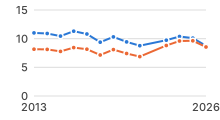
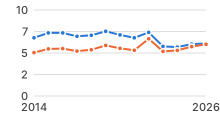
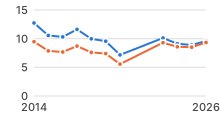
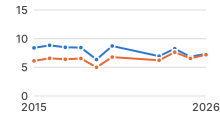
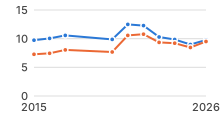
Median cubic centimetres of plastic per euro per year. Each panel has its own scale starting at zero. Years with fewer than three sets are left out. In 2021 and 2022 few sets count because of the price rule; an outlier in those years rests on few sets.
nominal (euros of that year) purchasing power (September 2026 euros)
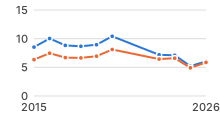
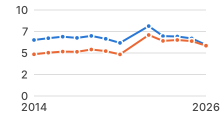
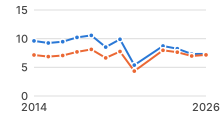
Comparable sets side by side
Within a theme the same kinds of sets keep coming back: a police station, a tow truck, an airport. Below are successors with the same recommended retail price. For the 4+ line we compare only with Juniors, the predecessor of 4+.
| Group | Kind of set and last known retail price | Sets, parts and cm³ of plastic (difference from the first) |
|---|---|---|
| City | Police station, €99.99 | 2014 60047 Police Station · 823 parts · 1373 cm³ 2017 60141 Police Station · 864 parts · 1395 cm³ (+2%) 2020 60246 Police Station · 715 parts · 1200 cm³ (−13%) |
| City | Tow truck, €19.99 | 2015 60081 Pickup Tow Truck · 201 parts · 218 cm³ 2017 60137 Tow Truck Trouble · 130 parts · 148 cm³ (−32%) |
| City | Fire station, €59.99 | 2019 60215 Fire Station · 493 parts · 652 cm³ 2022 60320 Fire Station · 517 parts · 884 cm³ (+35%) |
| 4+ and Juniors | Fire engine, €19.99 | 2014 10671 Fire Emergency · 115 parts · 206 cm³ 2021 60280 Fire Ladder Truck · 80 parts · 144 cm³ (−30%) 2025 60463 Fire Truck · 74 parts · 125 cm³ (−39%) |
| 4+ and Juniors | Garbage truck, €19.99 | 2015 10680 Garbage Truck · 91 parts · 162 cm³ 2019 60220 Garbage Truck · 82 parts · 118 cm³ (−28%) |
| 4+ and Juniors | Road construction, €19.99 | 2015 10683 Road Work Truck · 124 parts · 165 cm³ 2022 60325 Cement Mixer Truck · 77 parts · 125 cm³ (−24%) |
| 4+ and Juniors | Airport, €49.99 | 2018 10764 City Central Airport · 356 parts · 472 cm³ 2020 60261 Central Airport · 262 parts · 439 cm³ (−7%) |
| 4+ and Juniors | Road repair, €9.99 | 2018 10750 Road Repair Truck · 69 parts · 79 cm³ 2021 60284 Roadwork Truck · 54 parts · 87 cm³ (+10%) |
Not every successor has less plastic. The 2022 fire station and the 2021 road repair set contain more than their predecessor. Single pairs therefore prove nothing. The conclusions rest on all sets of a theme together.
How we calculate
- Volume per part. For almost every LEGO® part there is a 3D model in the LDraw library, an open collection maintained by fans since the 1990s. From those models we calculate the volume of more than 21,000 parts, in cubic centimetres. This is the plastic itself: the hollow inside a brick does not count.
- Why volume and not weight. LEGO® makes parts from different plastics with different densities. We do not know for every part which material it is made of.
- Parts per set. Rebrickable records which parts are in each set and how many. We add up the volume of all parts per set. Spare parts do not count. Minifigures count as a fixed 3.0 cm³ each.
- Price. The recommended retail price in euros from the Brickset database. LEGO® sometimes raises the price of a set that is already on sale, and the database keeps only the latest price. So sets released before 1 July 2022 count only if they were also retired before that date (the price rule). For 180 sets the database held the temporary German VAT price of 2020, such as €29.23 instead of €29.99; we converted those back.
- Purchasing power. Each price is multiplied by the rise in euro-area consumer prices between the month of release and September 2026 (Eurostat, HICP).
- Which sets. Sets with at least 50 parts, of which we know the volume for at least 95%. Not included: merchandise, books, promotional sets, education sets, electronics, the BrickLink Designer Program, separate minifigures and advent calendars. Creator Expert and Icons count as one theme. The 4+ line and its predecessor Juniors deliberately use large pre-formed parts and form their own group. A theme has enough data with at least 30 sets over at least 6 years, with at least 8 sets in both the first and the last three years.
- Trend. Per set: ln(volume / price) = a + b·time + c·ln(price). The change per year is (eb − 1) × 100%. Because of the price term, a shift towards larger or smaller sets does not count. The margin of uncertainty (95%) comes from 1,000 repetitions on random draws from the same sets.
How certain is this?
Every measurement involves choices: which sets count, which price, which currency. To see whether the nominal result depends on those choices, we recalculated everything in nine variants. Bold means outside the margin of uncertainty.
| Theme | base | incl. sets with possibly raised price | volume coverage 90% | 25 parts or more | 200 parts or more | in dollars (US) | in pounds (UK) | without minifigures | with advent calendars |
|---|---|---|---|---|---|---|---|---|---|
| Classic | −5.3% | −5.2% | −5.3% | −5.3% | −5.3% | −2.7% | −5.8% | −5.3% | −5.3% |
| Speed Champions | −4.8% | −4.8% | −4.7% | −4.8% | −5.1% | −5.3% | −4.3% | −4.7% | −4.8% |
| Icons (incl. Creator Expert) | −4.0% | −4.0% | −4.1% | −4.0% | −4.0% | −3.1% | −4.2% | −3.9% | −4.0% |
| 4+ and Juniors | −3.0% | −2.9% | −3.1% | −2.7% | – | −3.6% | −3.5% | −3.1% | −3.0% |
| Marvel Super Heroes | −2.5% | −2.5% | −2.5% | −2.3% | −3.2% | −4.0% | −2.8% | −2.4% | −2.8% |
| Technic | −2.4% | −1.9% | −2.4% | −2.4% | −3.0% | −1.0% | −1.9% | −2.4% | −2.4% |
| Ninjago | −2.2% | −2.2% | −2.1% | −1.5% | −2.3% | −2.4% | −2.9% | −2.3% | −2.2% |
| Creator | −2.2% | −1.1% | −2.3% | −2.2% | −2.6% | −2.3% | −2.8% | −2.1% | −2.2% |
| Harry Potter | −2.1% | −3.1% | −2.1% | −1.3% | −3.0% | −2.6% | −1.9% | −2.0% | −1.9% |
| Seasonal | −1.9% | −1.3% | −1.9% | −1.9% | −4.6% | +0.3% | −0.5% | −1.4% | −1.9% |
| Friends | −1.8% | −1.9% | −1.8% | −1.7% | −1.9% | −1.5% | −1.2% | −2.0% | −1.8% |
| Minecraft | −1.6% | −1.5% | −1.6% | −1.7% | −2.3% | −2.2% | −0.5% | −1.6% | −1.7% |
| Star Wars | −1.0% | −0.9% | −0.6% | −1.0% | −1.9% | −2.9% | −2.8% | −0.9% | −1.2% |
| BrickHeadz | −1.0% | −1.0% | −1.1% | −1.0% | −2.4% | −1.1% | −0.3% | −1.0% | −1.0% |
| DC Super Heroes | −1.0% | −0.6% | −1.0% | −0.7% | −0.5% | −2.8% | −1.9% | −0.9% | −1.0% |
| City | −0.9% | −1.1% | −0.9% | −0.8% | −1.4% | −1.4% | −2.4% | −0.7% | −1.1% |
| Ideas | −0.4% | −0.6% | −0.4% | −0.4% | −1.6% | −1.4% | −1.6% | −0.2% | −0.4% |
| Disney | +0.5% | +0.3% | +0.1% | +0.8% | – | −0.3% | −0.1% | +0.5% | 0.0% |
The themes demonstrated in nominal terms fall in every variant: in dollars, in pounds, with and without minifigures, for small and for large sets. For dollars and pounds we made no inflation adjustment.
Check with weighed parts. For 78 parts we know the weight from the catalogue of a parts shop. It shows that LDraw draws large parts slightly too large in relative terms. Correcting for that, the nominal result for all themes together becomes −1.0% instead of −1.1% per year, and in purchasing power +1.8% instead of +1.7%. No verdict for any theme changes. The figures in this article are the uncorrected ones.
Check against box weight. For 1,651 sets we know the weight of the full box. Converting the plastic with the density of ABS (1.05 grams per cm³), it is on average 59% of the box weight. The rest is cardboard, booklets and bags. For 6 sets the plastic comes out above the box weight; for one of them the database lists a box weight of 0.26 kg, which cannot be right.
What this study does not say
- No cause. We measure how much plastic per euro is in sets and how that changed. We do not measure why. Raw material prices, energy, licences, design choices and profit can all play a part.
- Purchasing power is measured generally. We adjust with the prices of all consumer goods in the euro area, not with toy prices.
- No verdict on building fun. A set with less plastic can have more building technique, more detail or better minifigures. This study does not measure that.
- Calculated, not weighed. LDraw draws some walls slightly thicker than the real parts. The deviation is present in all years.
- Not everything can be measured. We cannot measure Duplo, because hardly any Duplo parts are in LDraw. For the newest sets, new or printed parts are sometimes missing. Sets with more than 5% missing do not count.
Sources
- Part geometry: LDraw parts library (ldraw.org), version of 9 November 2026, used under the CC BY 4.0 licence.
- Parts per set: Rebrickable (rebrickable.com), data of 9 November 2026.
- Theme, year, price, age and retirement date: Brickset (brickset.com), via the Lakea database.
- Inflation: Eurostat, HICP euro area, all items, monthly index 2015 = 100 (dataset prc_hicp_minr), January 2012 to September 2026.
- Calculation: Lakea, November 2026.
Lakea is a price comparison site for LEGO® and works with partner links from shops. This article contains no partner links. LEGO® is a trademark of the LEGO Group. This study is not sponsored, endorsed or checked by the LEGO Group.
Comments
Join in — internationally, in any language.
No comments yet. Be the first!